Originally published at The New Stack: https://thenewstack.io/speed-trino-queries-with-these-performance-tuning-tips/
In this article, we will discuss how data engineers and data infrastructure engineers can make Trino, a widely used query engine that's faster and more efficient.
An open source distributed SQL query engine, Trino is widely used for data analytics on distributed data storage. Optimizing Trino to make it faster can help organizations achieve quicker insights and better user experiences, as well as cut costs and improve infrastructure efficiency and scalability. But how do we do that?
In this article, we will show you how to tune Trino by helping you identify performance bottlenecks and provide tuning tips that you can practice.
1. Performance Bottlenecks for Trino Queries
Let’s first identify the common bottlenecks that can slow down Trino queries before we dig into tuning tips.
Here are four key factors that affect Trino query performance:
- Compute resources: As a resource-intensive application, Trino uses a lot of CPU power for data processing and consumes memory to store source data, intermediate results, and final outputs. It is important to balance the number of CPU cores and the amount of memory for each node, keeping in mind the workload and available hardware resources.
- I/O speed: Trino is a storage-independent query engine, so it does not store any data on its local disk. Instead, it fetches data from external storage systems. This means Trino’s query performance is greatly influenced by the speed of the storage systems and network.
- Table scans: Table scan fetches data from a connector and produces data to be consumed by other operators, which can be another performance bottleneck, especially when working with large datasets. How tables are partitioned and the choice of file formats, like Parquet and ORC, can make a big difference in query speed.
- Joins: Joins, which merge data from many tables, are known as the most resource-intensive operation in Trino. If joins are not done efficiently, they can consume excessive CPU and memory resources, slowing down the whole Trino cluster.
You now know what the key factors are behind slow queries. It is a good starting point for performance tuning.
2. Process of Optimizing Trino
Performance tuning is a process instead of random steps. To optimize Trino’s query performance, follow the steps shown in the flow chart below.

- Step 1: Check if the entire cluster is slowing down through Trino’s Web UI.
- Yes: Proceed to step 2.
- No: Proceed to step 3.
- Step 2: See whether queries are queued or blocked from Trino’s Web UI.
- Queued: Refer to tip 1 and tip 2.
- Blocked: Refer to tip 1 and tip 2.
- Step 3: Identify the bottleneck in the slow query by running EXPLAIN ANALYZE.
- Slow table scans: Refer to tip 3.
- Slow joins: Refer to tip 4.
Trino cluster’s Web UI is very helpful here. You can quickly assess the overall state of your cluster, whether there are more blocked or queued queries.
To analyze individual query plans and performance, use the EXPLAIN ANALYZE commands, which provide details about execution time and processed rows. Let’s take a look at an example.
EXPLAIN ANALYZE select * from customers limit 5;
With the above command, you will get an output. As highlighted, EXPLAIN ANALYZE will show you the actual execution statistics, helping you identify the bottleneck of the query execution process.

3. Tuning Tips for Trino
Now, let’s talk about how to fine-tune Trino for better performance.
Tip 1: Optimize Resource Allocation
Trino needs the right amount of memory to work well. It is important to monitor how much memory it is using and adjust its settings if needed. You can customize the maximum memory and number of concurrent queries in Trino in order to effectively manage resource allocation.
Make sure you have the right balance between the maximum memory for each query and the number of queries running at the same time. This depends on the resources you have for Trino. Adjusting parameters for maximum concurrency and memory may result in blocked or queued queries.
Recall step 2, which is to identify whether queries are blocked or queued. If you find many blocked queries, increase memory or reduce the maximum number of concurrent queries. If you see many queued queries, you will need to add more CPU resources or reduce the concurrency.
To avoid memory allocation deadlocks or low query performance, use these settings:
Property NameSuggested ValueCommentsquery.max-memory-per-nodeJVM heap size / max_concurrentThis value can fluctuate. A higher value can speed up large queries, and a lower value can reduce the risk of memory allocation deadlocks.query.max-memoryDo not set this limitation if the query.max-memory-per-node has been set properly.query.low-memory-killer.policytotal-reservationOnly set this value when you are suffering from memory allocation deadlock. This value will kill the query currently using the most memory.
Tip 2: Improve I/O (Storage and Network)
Trino, a storage-independent query engine, fetches data from remote storage for each query. If you experience low I/O throughput or high network latency, it can lead to queries being queued or blocked while fetching data. So the solution for queued and blocked queries, besides optimizing compute resources, is to improve I/O.
Here are some ways to accelerate I/O:
- Use faster storage: A faster storage system, such as a hotter storage tier of Amazon S3, can improve data retrieval speed.
- Reduce network latency: You will need to set up low latency network connectivity between Trino and the storage system to minimize data transfer delays.
- Caching: Implementing a caching layer, such as Alluxio, can help you reduce query latency, especially for remote storage, or data sharing between Trino and other compute engines. Caching can significantly accelerate remote data reading by bringing data locality to Trino workers.
Optimizing I/O can ultimately enhance the overall query execution speed.
Tip 3: Table Scan Optimization
In EXPLAIN ANALYZE, when you see table scan issues, you should pay attention to file format, compression, partitioning, bucketing or sorting methods.
Here are our recommendations:
- Columnar data file formats and compression: Trino reads columnar data files by first accessing the metadata stored at the footer of the files, which determines the structure and data section locations in the files. Reading data pages in parallel, Trino employs many threads to read and process column data efficiently. Columnar formats optimize query performance by skipping unnecessary columns and enabling predicate pushdown based on statistics stored in the metadata. Columnar formats like ORC and Parquet are recommended because they support predicate pushdown and efficient data compression. ORC often outperforms Parquet in Trino, but efforts are being made to improve Parquet’s performance in the Trino community.
- Flat table column layout and dereference pushdown: Since Trino 334, Trino introduced a new way to query nested columns less costly, which is dereference pushdown. If you don’t see any benefits from dereference pushdown, choose the flat table column layout.
- Partitioning and bucketing: You can improve query performance by dividing tables based on partition columns. This way, Trino doesn’t have to access unrelated partitions. However, excessive partitions can hinder planning and increase storage pressure. Too many partitions can slow down planning and put pressure on storage. Bucketing, a form of hash partitioning, which divides tables into a set number of hash buckets based on selected columns, can help manage these issues.
Below is an example of creating a table with partitioning and bucketing:
CREATE TABLE customers ( customer_id bigint, created_day date ) WITH ( partitioned_by = ARRAY[created_day], bucketed_by = ARRAY['customer_id'], bucket_count = 100 )
Tip 4: Join Optimization
EXPLAIN ANALYZE will also identify slow joins. Joins are considered the most expensive operation in any query engine, but you can work on optimizing join distribution types and join orders. Trino’s cost-based optimizer (CBO) can determine the most effective join methods based on table statistics. For join optimization, consider join distribution types, join orders and leverage dynamic filtering when applicable.
Before diving into join distribution, let’s understand the concepts of “probe table” and “build table.” Trino uses a hash join algorithm, where one table is read into memory, and its values are reused while scanning the other table. The smaller table is typically chosen as the “build table” to conserve memory and improve concurrency.

There are two types of join distributions in Trino.
- Partitioned join: Each node builds a hash table from a fraction of the build table’s data.
- Broadcast join: Each node builds a hash table from all the data, replicating the build table’s data to each node.
Broadcast join can be faster but requires the build table to fit in memory. Partitioned join may be slower but has lower memory requirements per node. Trino automatically selects the appropriate join distribution strategy, but you can change it using the join_distribution_type session property.
You should also optimize join orders, which aims to minimize the data read from storage and data transfer between workers. Trino’s cost-based join enumeration estimates costs for different join orders and picks the one with the lowest estimated cost. You can set the join order strategy using the join_reordering_strategy session property.

Another join optimization strategy is to enable dynamic filtering. Dynamic filtering can help in some join scenarios, reducing the number of unnecessary rows read from the probe table. Trino applies a dynamic filter generated by the build side during a broadcast join to reduce probe table data. Dynamic filtering is enabled by default but can be disabled using the enable_dynamic_filtering session property.
Implementing these join optimization strategies can help you enhance the efficiency and performance of Trino queries.
4. Summary
In this article, you learned how to tune Trino for speed and efficiency. When using Trino in production, keep an eye on resource allocation, I/O improvement, table scan and join optimization.
Remember, performance tuning is not a one-time task. It is a continuous process that requires regular checks, tests and changes based on your specific use cases and workload patterns.
.png)
Blog

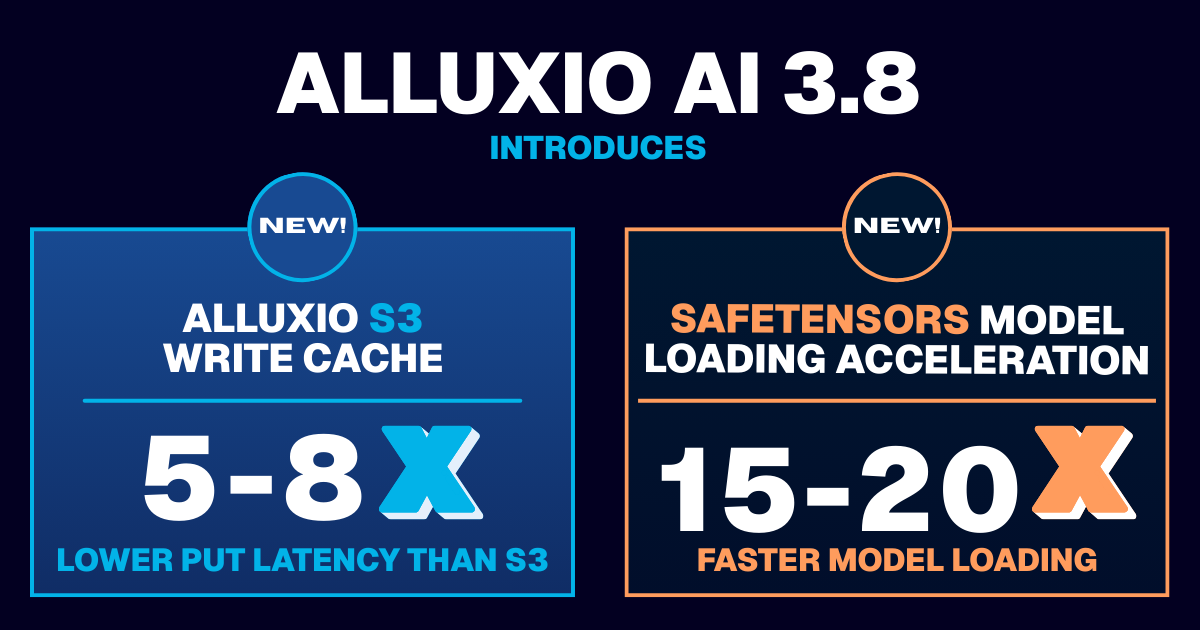
Learn about the new features in Alluxio AI 3.8 designed to eliminate two of the most painful bottlenecks in modern AI pipelines. Introducing Alluxio S3 Write Cache, which dramatically reduces object store write latency and improves write-heavy workload performance, and Safetensors Model Loading Acceleration that delivers near-local NVMe throughput for model weight loading

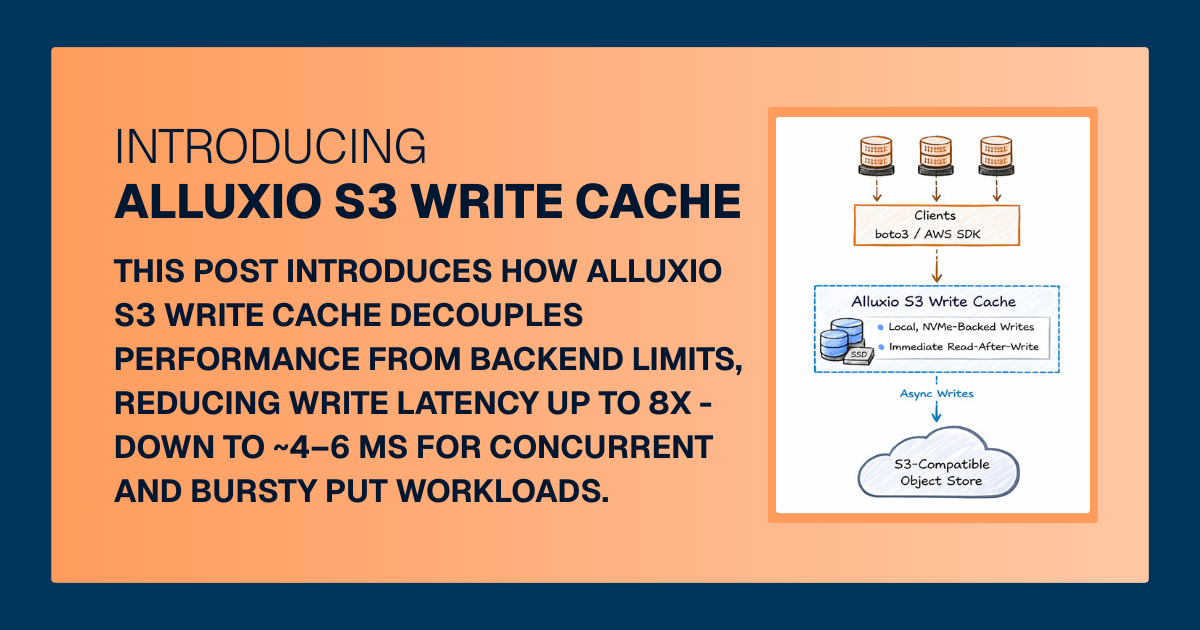
For write-heavy AI and analytics workloads, cloud object storage can become the primary bottleneck. This post introduces how Alluxio S3 Write Cache decouples performance from backend limits, reducing write latency up to 8X - down to ~4–6 ms for concurrent and bursty PUT workloads.

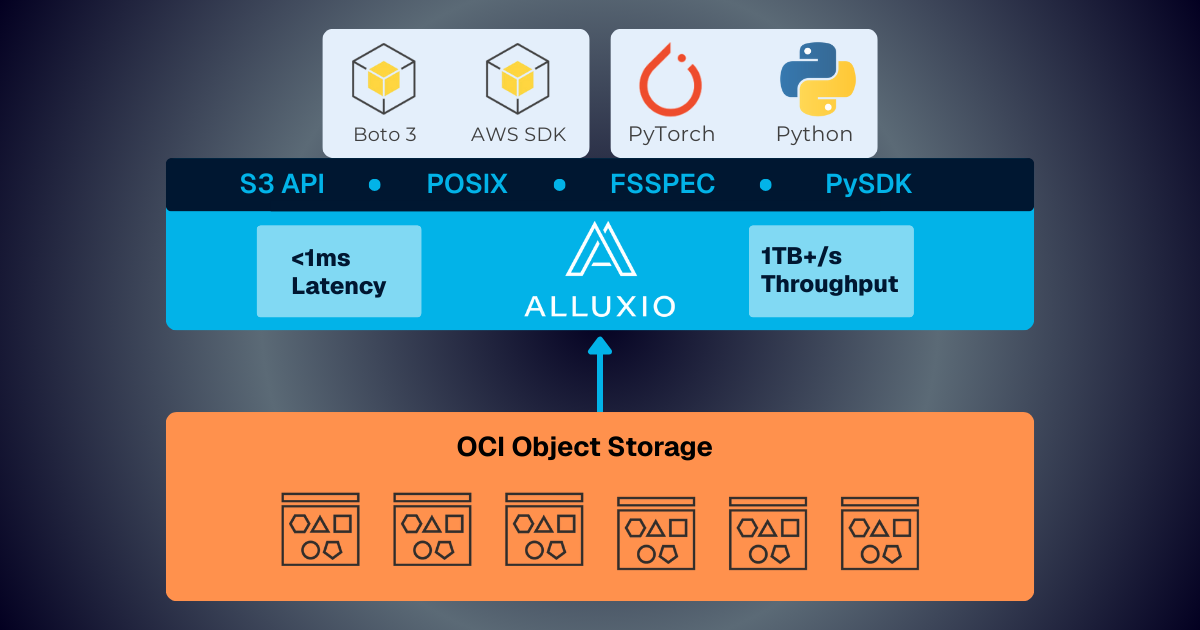
Oracle Cloud Infrastructure has published a technical solution blog demonstrating how Alluxio on Oracle Cloud Infrastructure (OCI) delivers exceptional performance for AI and machine learning workloads, achieving sub-millisecond average latency, near-linear scalability, and over 90% GPU utilization across 350 accelerators.
